Stock broke out big the last two days, exactly the bounce I was looking for. Closed these out for almost 77% of max profit in less than 4 trading days. Can always put them back on if the stock falls again or look for other opportunities.
Trade:
BTC CF July 12 145/140 bull put spreads for ($0.60-$0.39) x 100 x 5 lots = $105 paid vs. $450 received = $345 profit
6/14/12
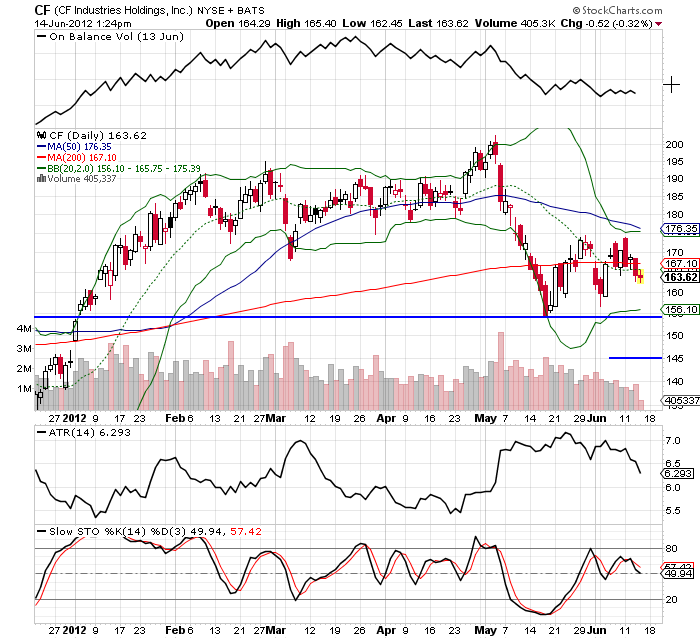
CF Industries (CF) has been selling off the past few days after bouncing off the low of 155. Going to use the weekly chart (top one) for the thesis of this trade. It always helps to look at multiple time frames to see the long-term trend.
In this case, the trend is obviously up, dating back to the June '10 lows. The stock has bounced off the trendline a few times, but as you can see from the OBV line, money is still coming into the stock. The weekly stochastics are also oversold. Possibility of a bounce is present here.
Going back to the daily chart (bottom one), I'm keeping the short strike below the lows from last month, and below the Bollinger band. Also nearly 3 full ATRs away. Current probability of max profit is 79%.
Trade:
Sold CF July 12 145/140 bull put spreads for ($3.07-$2.17) x 100 x 5 lots = $450 premium received

No comments:
Post a Comment